Visual Debuggers
Visual debuggers
Almost all languages have a visual debugger built into the integrated development environment (IDE) that you use for that language: IntelliJ has a debugger for Java, Visual Studio has a debugger for C# (and other languages), Spyder has a debugger for Python.
While we can’t comprehensively cover all different visual debuggers, most of the skills you’re going to learn about the debugger you’re using will transfer to other visual debuggers.
We’re going to be using a visual debugger for Java that comes as an extension for Visual Studio Code.
Getting started
You’ve already got VS Code installed on your machine. We’re going to be debugging some Java code and VS Code doesn’t have support for Java by default. Thankfully, though, we can install an extension to help us get support for the language.
Microsoft recommends that you install the Extension Pack for Java. The [Extensions Pack for Java] page lists install instructions, and you should follow those instructions.
Once the extension pack has finished installing a “Get Started” document should open:
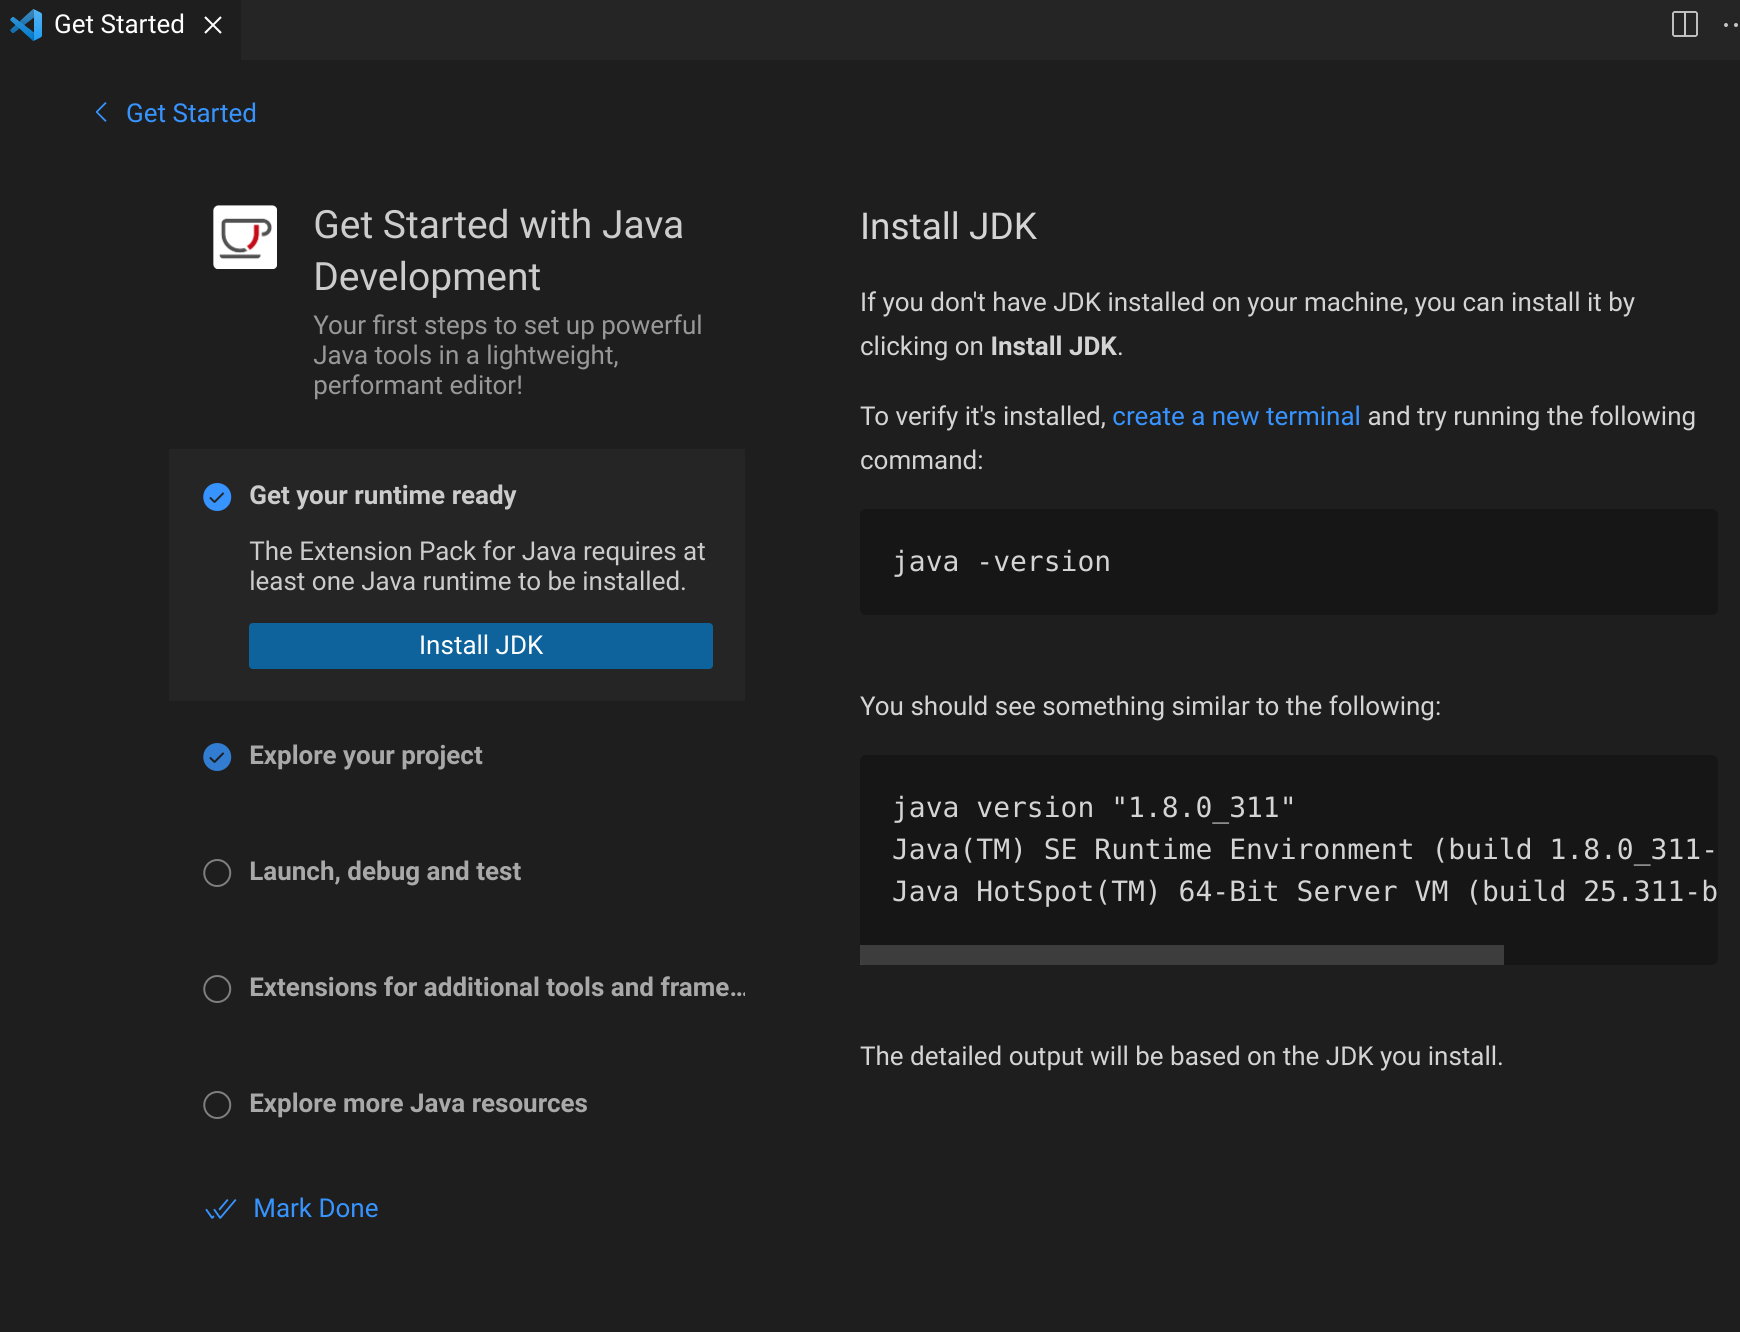
If you’ve never installed a JDK (or don’t remember if you have, or don’t know if your VS Code is configured to use the JDK), you should install one (or configure VS Code to find your JDK).
Before doing this check to see if you have a JDK installed by
following the instructions in the “Get Started” document (open a
terminal and run java -version). If you get output here
that isn’t something of the form “Command not found”, then you’ve
already got a JDK installed and configured and you can safely skip this
step.
Installing a JDK in Windows
Click on the “Install JDK” button. The defaults that VS Code suggests are good defaults that you can accept: Adoptium’s Temurin, version 17 (LTS), and JVM is hotspot.
Click on the Download button, find the .msi file in your
Downloads folder, and follow the on-screen prompts.
After you’ve finished installing the JDK click on the “Reload Window” button.
You should now be ready to run and debug Java programs!
Installing a JDK in macOS
Click on the “Install JDK” button. The defaults that VS Code suggests are good defaults that you can accept: Adoptium’s Temurin, version 17 (LTS), and JVM is hotspot.
Click on the Download button, find the .pkg file in your
Downloads folder, and follow the on-screen prompts.
After you’ve finished installing the JDK click on the “Reload Window” button.
You should now be ready to run and debug Java programs!
Installing a JDK in Linux
The installer that VS Code offers to help you by downloading is…
fine, but it’s a pain to configure. I recommend you use your package
manager instead. On Debian or Ubuntu-based distributions you can use
apt:
sudo apt install openjdk-17-jdkAfter the install completes, you may need to click on the “Install JDK” button in VS Code, then click on the “Reload Window” button.
You should now be ready to run and debug Java programs!
Running Java in VS Code
Once you’re set up, you can start debugging!
Here’s a very small Java program (you can copy and
paste this into a new file in VS Code, save it as
HelloWorld.java):
import java.util.Scanner;

public class HelloWorld
{
    public static void main(String... args)
    {
        final Scanner sc = new Scanner(System.in);
        final int left, right, sum;

        System.out.println("Let's add x+y!");
        System.out.print("Enter the left side (x): ");
        left = sc.nextInt();

        System.out.print("Enter the right side (y): ");
        right = sc.nextInt();

        System.out.println("Thanks! Calculating...");
        sum = add(left, right);
        System.out.printf("The sum is: %d\n", sum);
        System.out.println("Thanks for letting me calculate for you!");
        sc.close();
    }

    public static int add(final int left, final int right)
    {
        final int sum;

        System.out.println("\tAbout to add left to right.");
        sum = left + right;
        System.out.println("\tHeading back to the caller.");

        return sum;
    }
}
OK, maybe it’s not that small, but it is mostly println
statements.
Once you save the file, VS Code may, uh, think for a little bit while it compiles your code and stuff. While VS Code is thinking, you’ll see some indication that it’s doing something in the form of a spinner in the bottom right side of the window.
Eventually you’ll be able to run the program in VS Code when you see
the options to Run or Debug just above the main method:
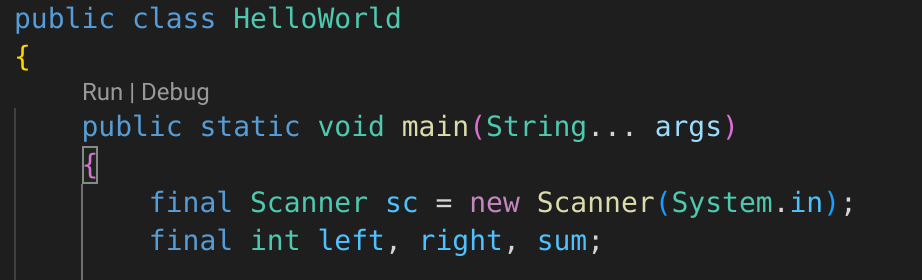
Click on the Run button for now, just to verify that your environment works correctly. If your environment is working correctly, the program should start running in a terminal pane in VS Code.
Debugging in VS Code
Click on the Debug button now:
Suddenly a lot has changed about our window.
… or if you’re running macOS, maybe it hasn’t. If these new panes didn’t show up, click on the debug button on the left side of the window, it’s the button that looks like a play button with a little bug on in.
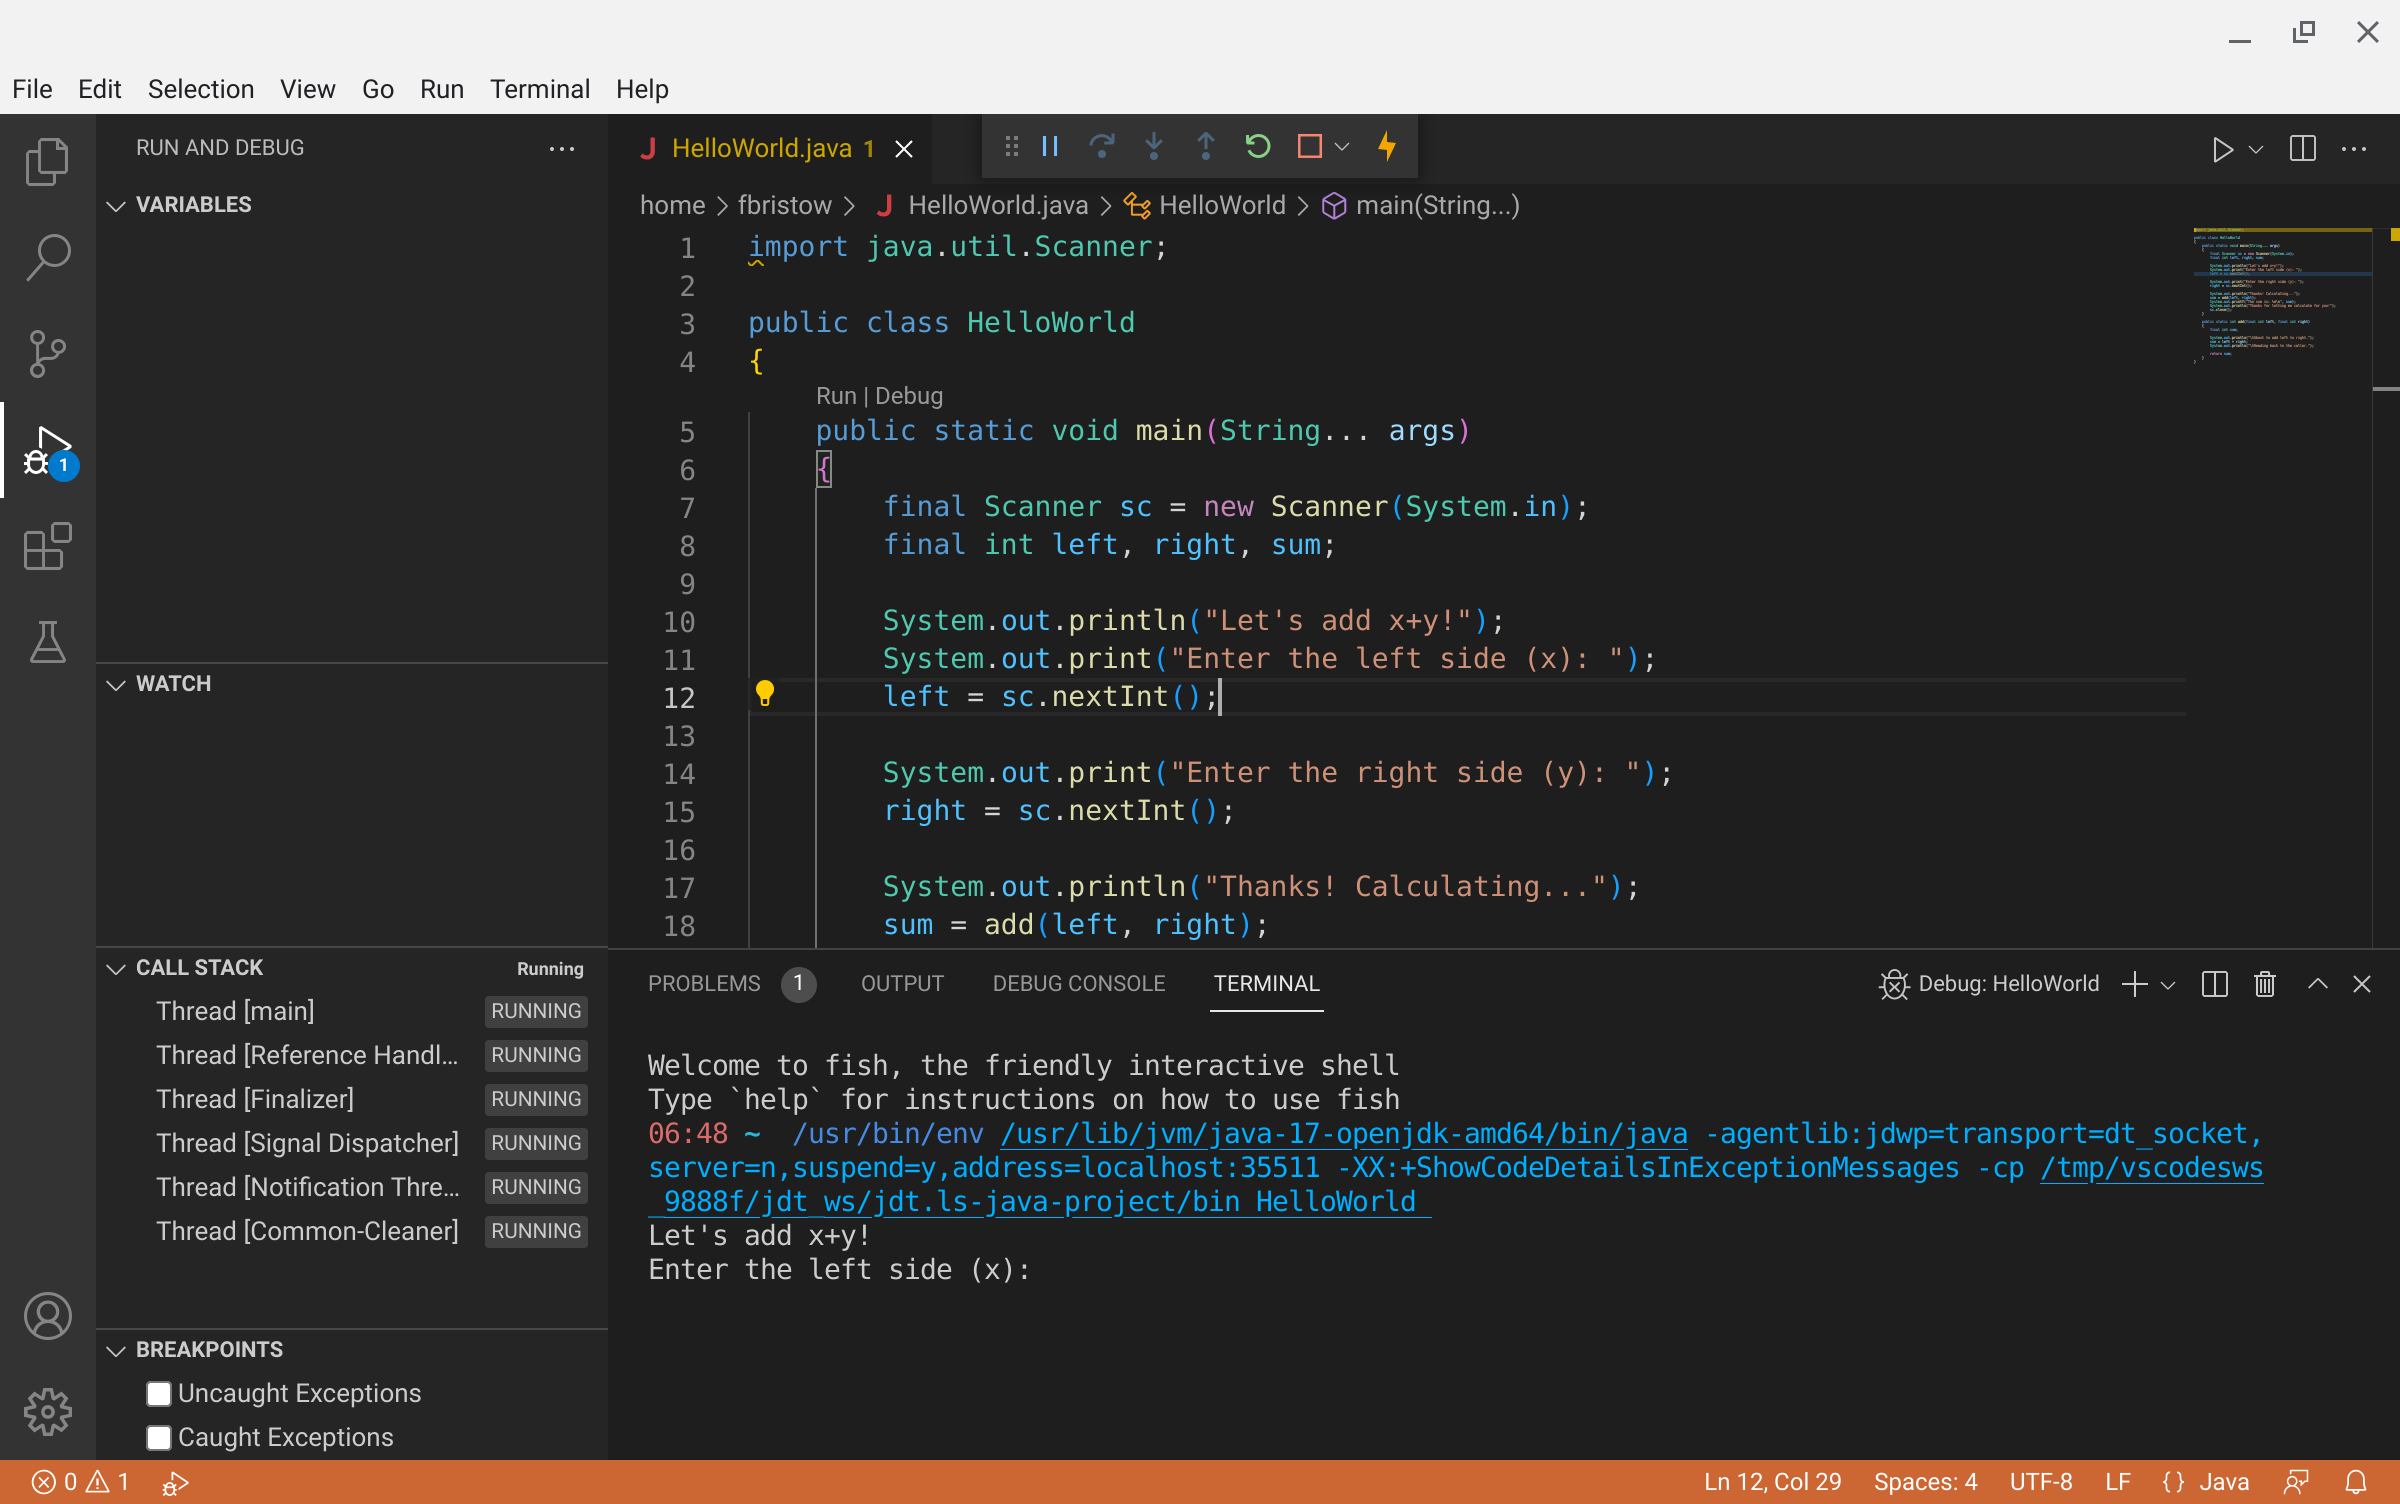
On the left side of the window are four new panes:
- The Variables pane, listing variables that are in scope and their current value.
- The Watch pane, where you can enter expressions to be evaluated so you can see how they change without writing those expressions in your program.
- The Call stack pane, showing information about the methods that have been called (this is similar to the stack trace you see when a Java program crashes).
- The Breakpoints pane, where you can see a list of places in your program that will cause the debugger to pause execution (exceptions) or where you have set a breakpoint in your code.
On the top is a new toolbar that has (in this order):
- A pause button to pause your running program.
- A step over button to run a line of code and move to the next one.
- A step into button for when you want to move into the method instead of running it to completion.
- A step out button for when you want to finish running the method and go back to where you were before.
- A stop button to stop your running program.
- A hot code replace button for when you make changes to your code while the debugger is running, replacing the running code with the newly saved file.
Right now your program is blocked waiting for you to type something in. Type in some numbers in your terminal and the program will finish running. Other than briefly changing the layout, debugging hasn’t given us any new tools for learning about the flow and state of our program…
Setting breakpoints
One of the main things you’ll do with a debugger is set breakpoints. As before, breakpoints are the places and/or conditions where you want the debugger to stop running your code so you can look around.
You can set a breakpoint in VS Code by moving your mouse to where the line numbers are, then clicking on the red circle that shows up just to the left of the line number:
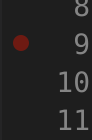
Pick a line in the code where you would like the program to stop when
the debugger is running. I’m going to suggest you set a breakpoint on
line 17, just after the Scanner-based input is done.
Once you’ve set your breakpoint (the red circle should be brighter and stay there when you move your mouse away), click the Debug button again. You’re going to have to enter the numbers again, but just after you enter the last number the contents of the panes will now have values, and the line where the program has paused on will be highlighted:
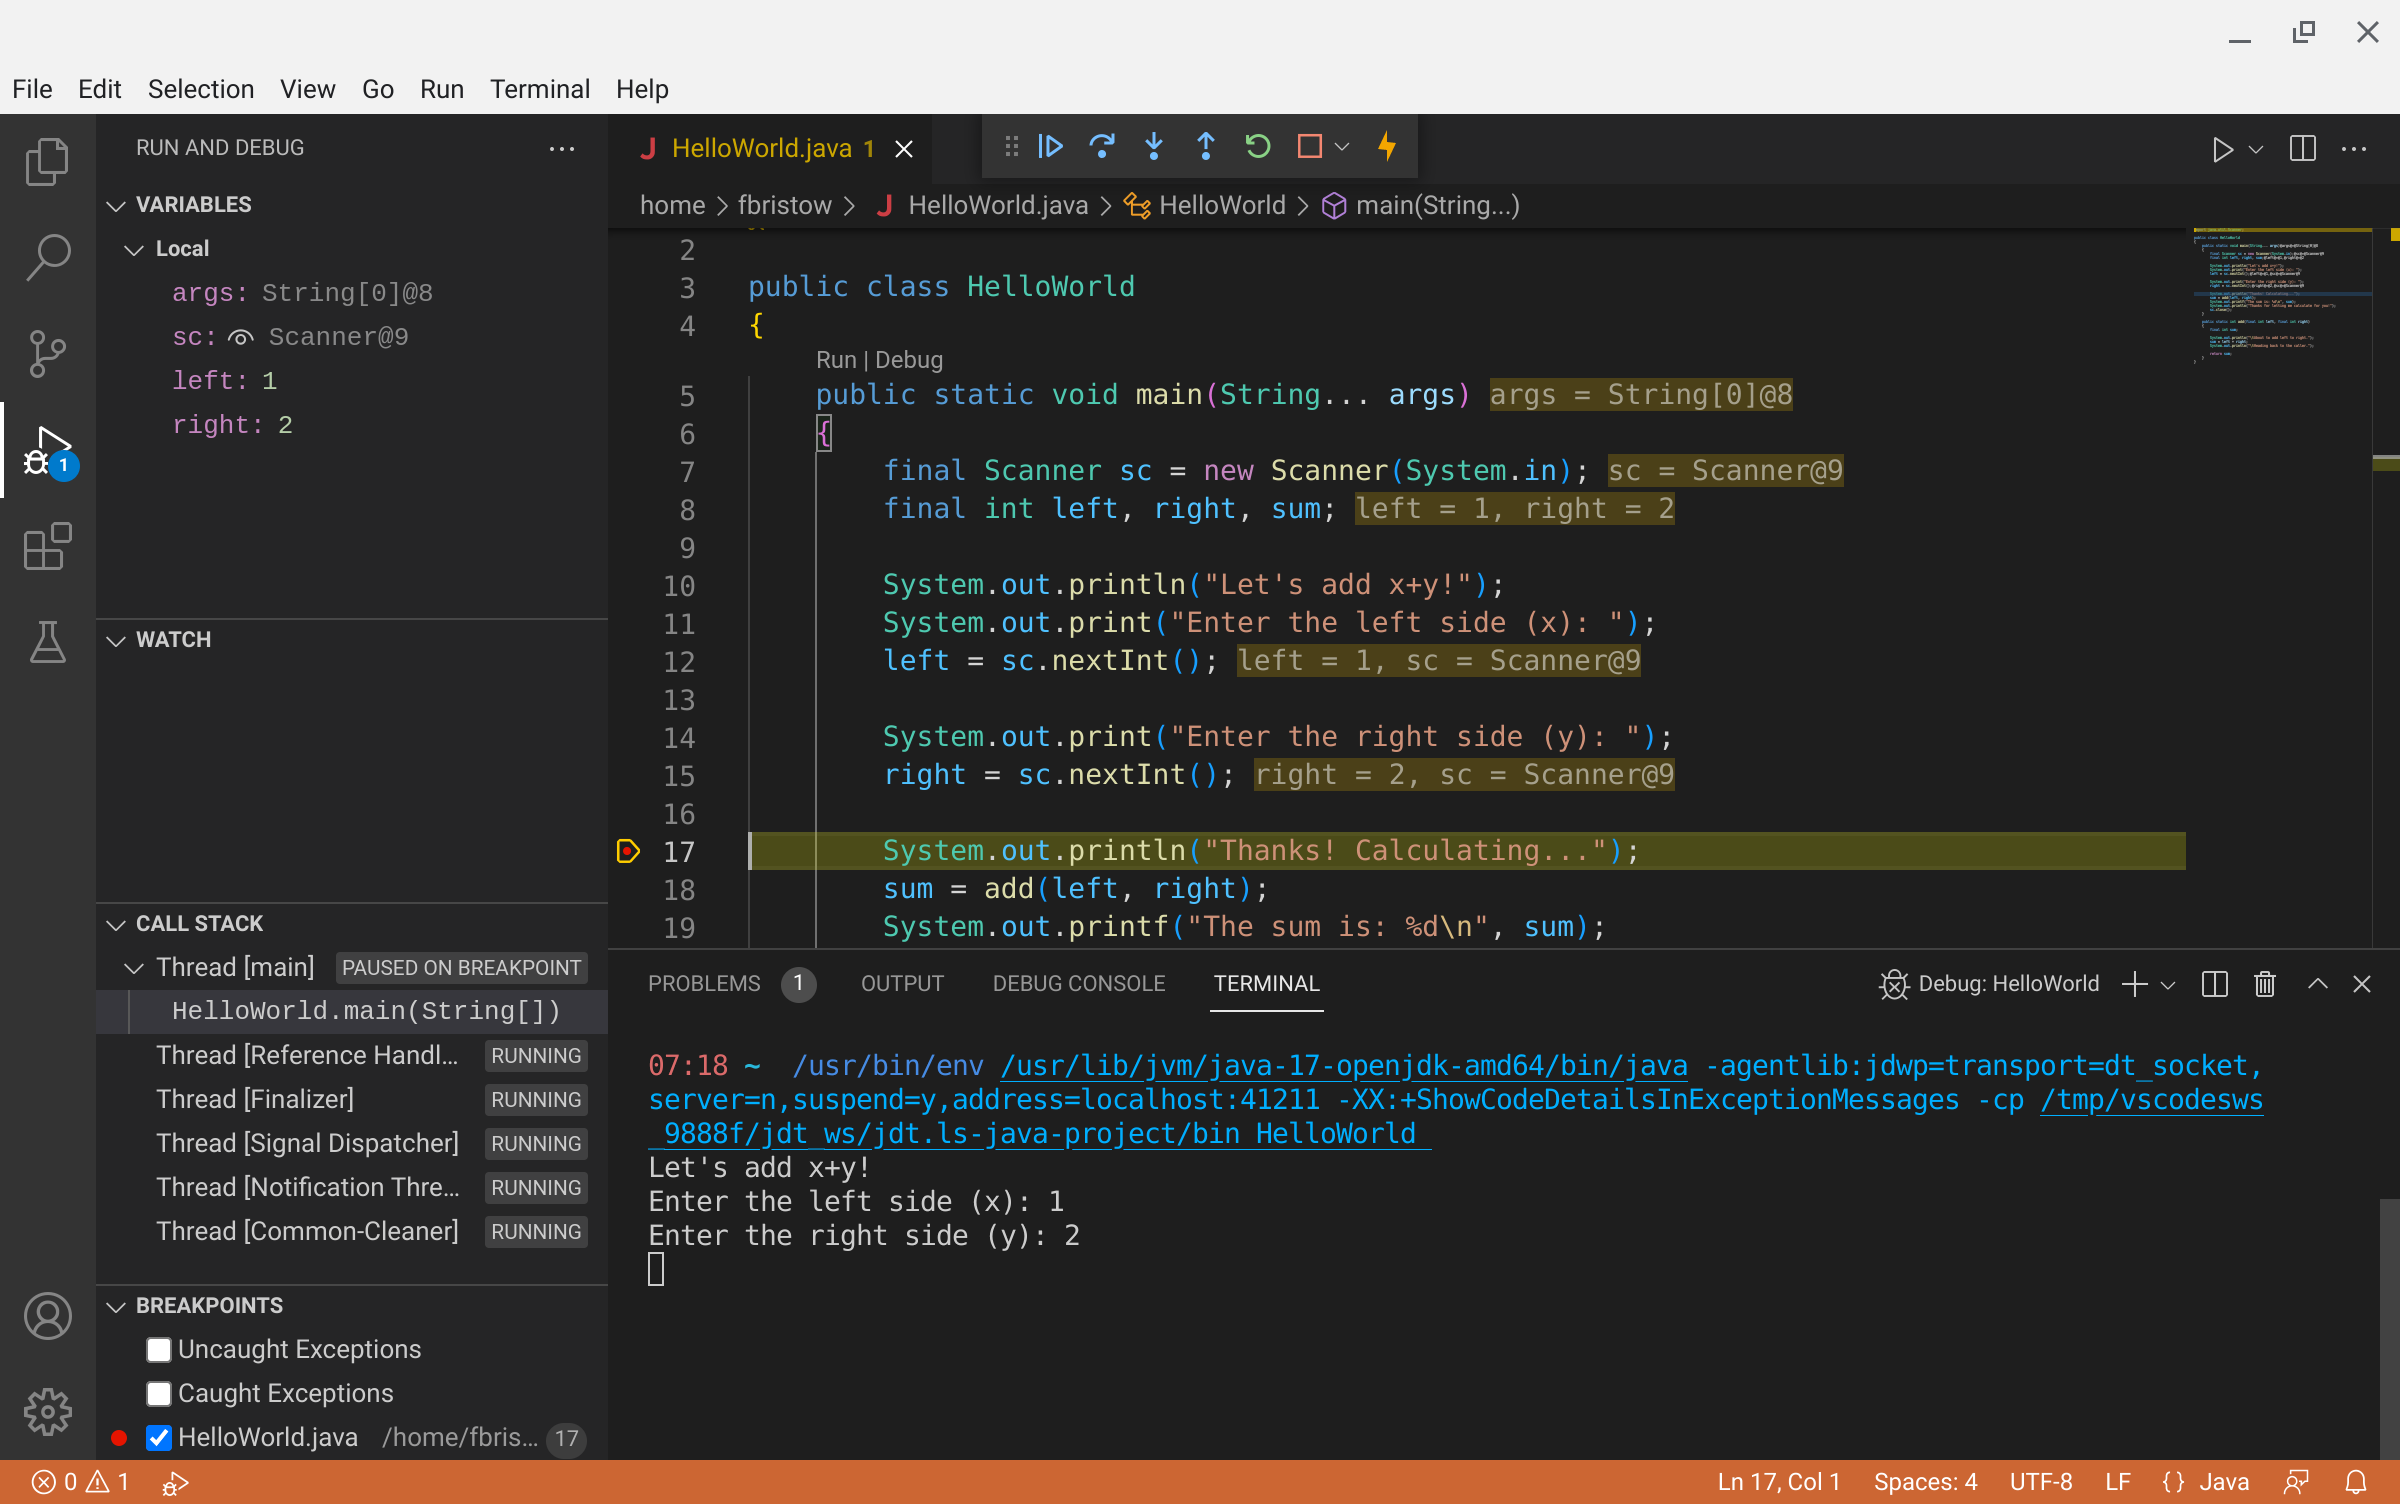
In the variables pane you can see the names of all variables that are
currently in scope (args, the values passed to your program
on the command line, sc our Scanner,
left, and right; sum doesn’t show
up because it hasn’t been initialized with a value yet). You can also
see these values on lines in the editor area where they are used.
Stepping over
Click on the Step over button. This will run the
line that was highlighted, then move to the next line. If you set your
breakpoint on line 17, then the System.out.println was run,
and you can see the output in your terminal.
Now the next line of code is highlighted (where we call
sum).
Stepping into
Let’s step into this method, click on the Step into
button. This changes the location of the highlighted line to be
in the sum method:
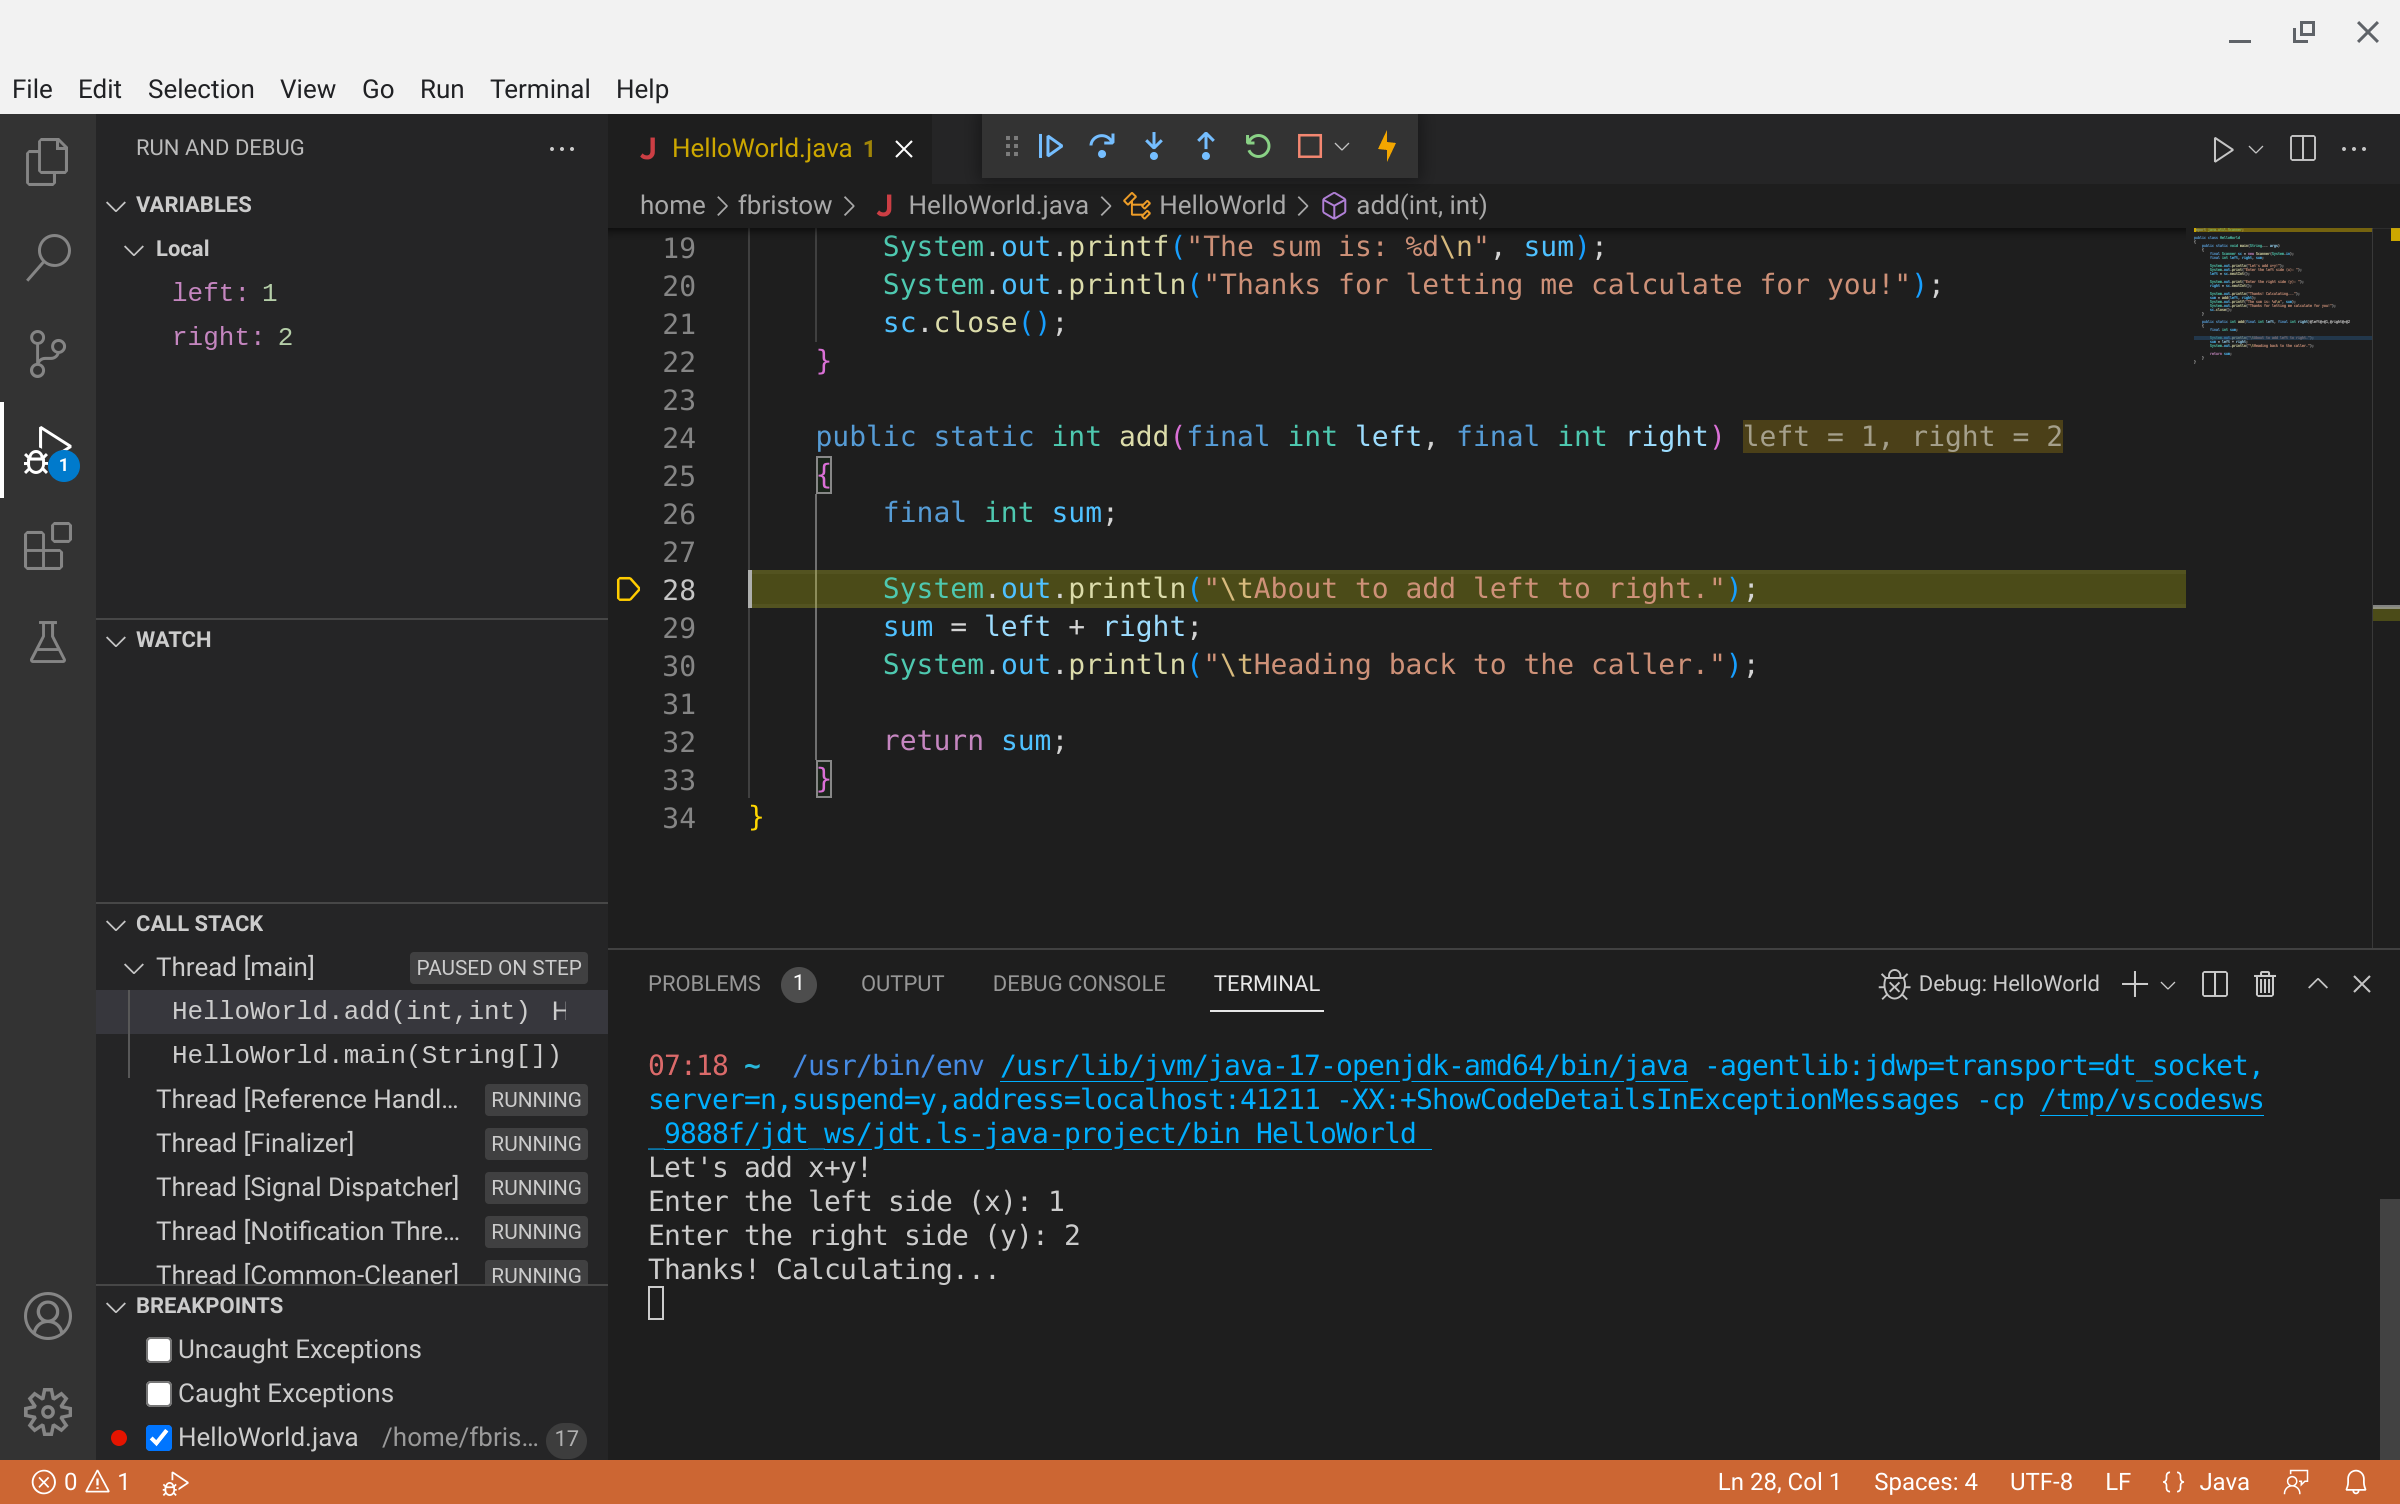
The content of the Variables pane has changed, now
it’s only what’s in scope in the sum method
(left and right).
The content of the Call Stack pane has also changed.
Before the only line under Thread (main) was
HelloWorld.main, and now that we’re running code in the
sum method, we’ve added that to our call stack.
You can click on entries in the call stack to see what things looked
like in the method that got you here. Click on the
HelloWorld.main entry and you’ll be taken back to the place
where we called sum in main, and you can
review the state of the variables in the Variables pane
again.
Stepping out
Click back on HelloWorld.add in the Call
Stack pane. You should be highlighting line 30 right now.
Click the Step over button twice, once to run the
System.out.println and another time to run the
sum = left + right.
Now click on the Step out button. Stepping out runs the remaining lines in the method, then returns you to where you were before.
Finishing
At this point you can click on either the Pause/Play button to finish running the program, or click on the Stop button to end the program without finishing.
Catching crashes
Debuggers can also help when your code crashes. Disable the breakpoint you set by clicking on the red circle, then click the Debug button again to restart debugging.
Just after debugging starts, click the checkboxes in the Breakpoints pane to catch both “Uncaught exceptions” and “Caught exceptions”.
Once the code is running, enter something that isn’t a number and press Enter. As soon as you do that, the debugger will pause execution because an exception was thrown:
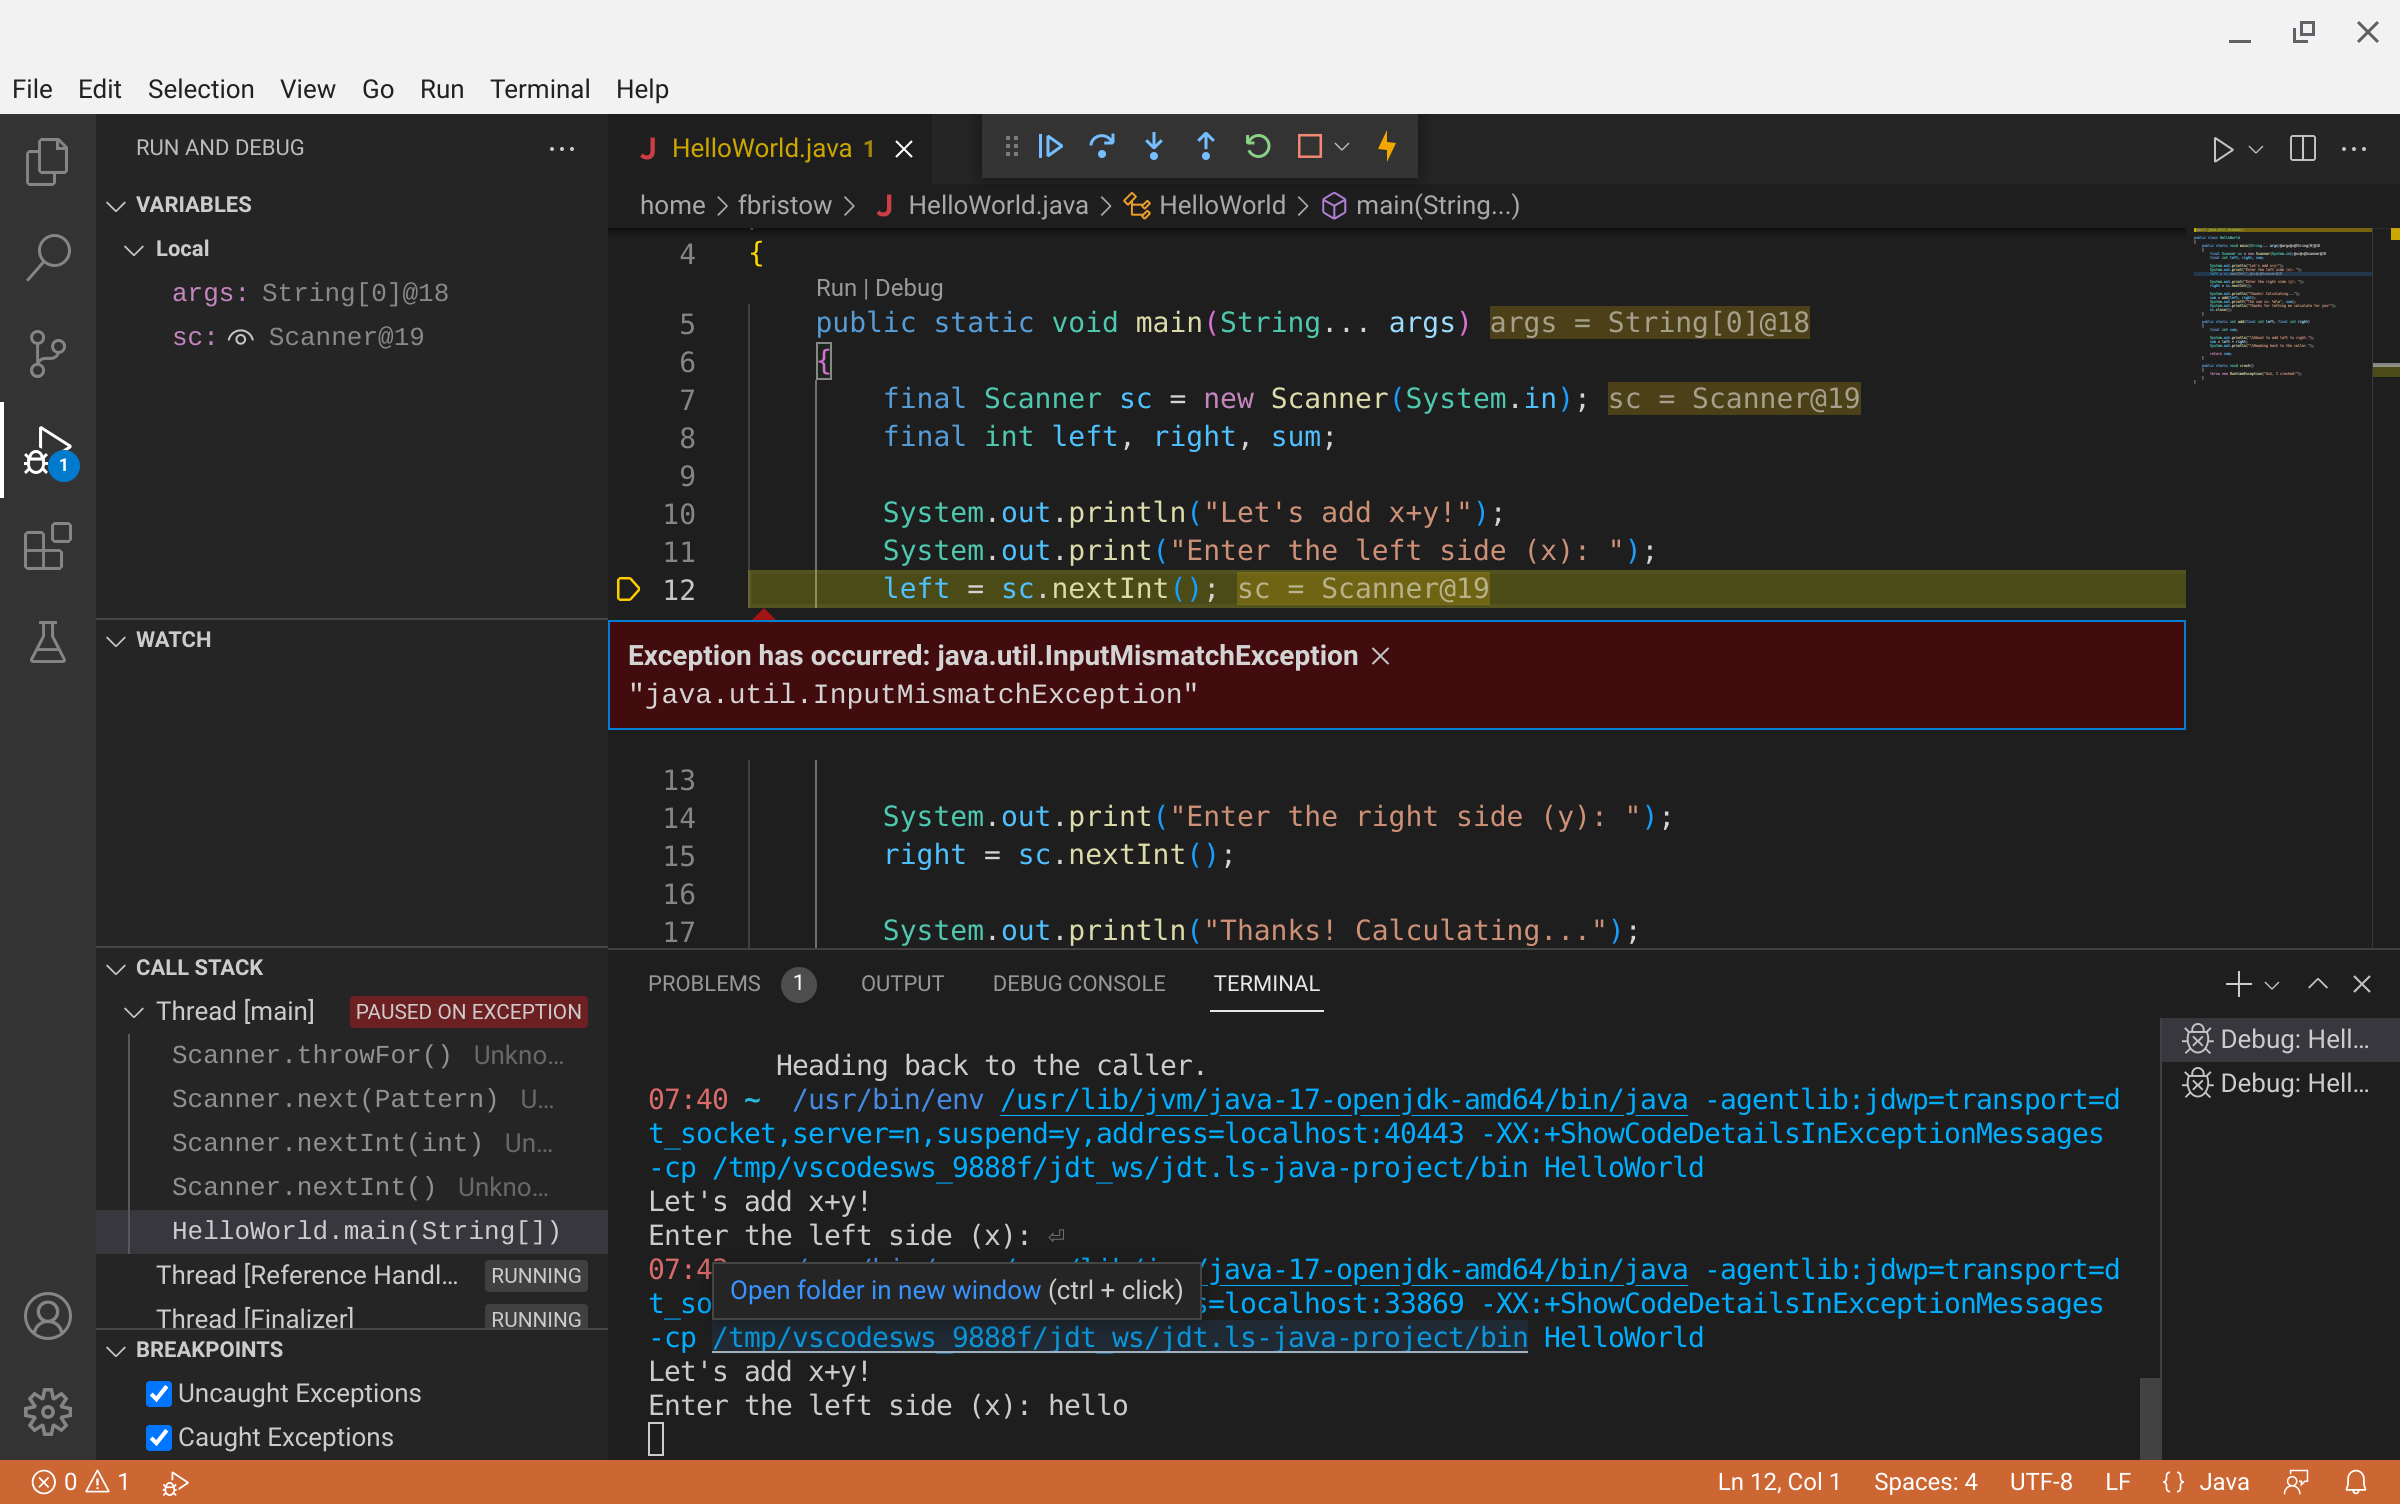
We can see in the Call Stack pane that
Scanner is throwing the exception and that the exception is
an InputMismatchException. You may be able to
click on the stack entries for Scanner if you have
installed the source code for the JDK. When this is in a call stack for
your own program, you can click on the methods and see the state your
code was in just before the crash happened.
Further reading
These are the basics for using the debugger in VS Code, and there’s a lot we didn’t go into. You can read a lot more on the Running and debugging Java page on VS Code’s home page.
The ideas we’ve worked through are present in almost all visual debugging tools. Here’s a short list of IDEs with debuggers that have similar functionality to VS Code’s debugger: